NBA Defensive Matchup Analysis for Player Props
 Available in US
Matchup Data Beats Season Averages Every Time for NBA Prop Research
The single most impactful improvement I made to my NBA prop research was moving from “what does this player average?” to “what does this player average against this specific type of defence?” That reframe sounds obvious when stated directly. In practice, it requires building a different research habit — one that starts with the matchup and works backward to the player, rather than the reverse. Players whose season averages look identical can have wildly different expected outputs tonight depending on who they’re guarding them, and most prop lines don’t fully capture that granularity.
NBA defensive matchup data is more accessible now than it’s ever been. Individual defender assignments, opponent field goal percentage by shot type, and defender-specific metrics are available through free platforms — which means the information advantage available to bettors who use this data is not about having premium access; it’s about using freely available data that most bettors simply don’t bother to consult. The edge in a market where the information is free comes from the discipline to apply it consistently, not from proprietary access.
Professionally researched player props show win rates of 55–58%. Matchup-aware research — specifically identifying games where the defensive context differs meaningfully from the season average — is one of the primary ways systematic bettors generate those above-breakeven results. The bookmaker’s hold rate of 9.3% at American sportsbooks in 2024 reflects how consistently bettors who ignore matchup data lose over time. Accounting for it correctly doesn’t guarantee winners; it improves the quality of your probability estimates in a way that compounds into long-run profitability.
Using Team Defensive Ratings for Player Scoring Props
Defensive rating (DRTG) — points allowed per 100 possessions — is the entry-level team-level matchup metric. It tells you whether an opponent allows more or fewer points than average across all opponents combined. A team with a DRTG of 108 is allowing 4 more points per 100 possessions than league average; a team with DRTG of 104 is holding opponents below average. For scoring props, the expected direction of adjustment from the player’s season average is clear: higher DRTG means easier scoring environment, lower DRTG means harder.
The limitation of aggregate DRTG is that it bundles together defensive performance against all player types and shot locations. A team with an excellent overall DRTG might still rank in the bottom third of the league in defending perimeter isolation plays — which is exactly the shot type a specific wing scorer primarily uses. Aggregate DRTG tells you about general defensive quality; shot-type specific opponent data tells you whether the matchup is specifically favourable or unfavourable for your target player’s offensive game.
The specific breakdown I reach for most often: opponent three-point percentage allowed from the corner (for shooters), opponent field goal percentage at the rim (for drivers and big men), and opponent free throw rate (which reveals how aggressively defences foul, relevant for players who generate heavy free throw volume). Each of those metrics has a clear connection to specific player scoring archetypes, and they’re more predictive of individual game output than aggregate DRTG alone.
The practical workflow: identify your target player’s primary scoring method — isolation mid-range, drive-and-kick, catch-and-shoot three, roll to the basket — and then look at the opponent’s defensive performance specifically on that shot type against comparable players. That matchup-specific defensive data, compared to the player’s per-possession scoring efficiency on those shots, gives you a much better-grounded probability estimate than season averages versus aggregate DRTG.
Tracking Individual Defender Assignments and Their Impact on Prop Lines
Team-level defensive ratings describe the system. Individual defender assignments describe the specific challenge your target player will face on any given possession. These are different analytical layers, and both matter — but the individual assignment is often more directly predictive of a specific player’s scoring output than any team-level metric.
Elijah Jackson of sportsgambler.com articulated this precisely: NBA player analysis for prop purposes focuses on “usage, minute distribution, and matchup context” rather than headline box-score figures — specifically evaluating how “rotation factors, injury absences, pace, and defensive assignments influence a player’s role in a specific match.” The defensive assignment is part of that matchup context, and it’s one that changes game to game in ways that prop lines don’t always reflect.
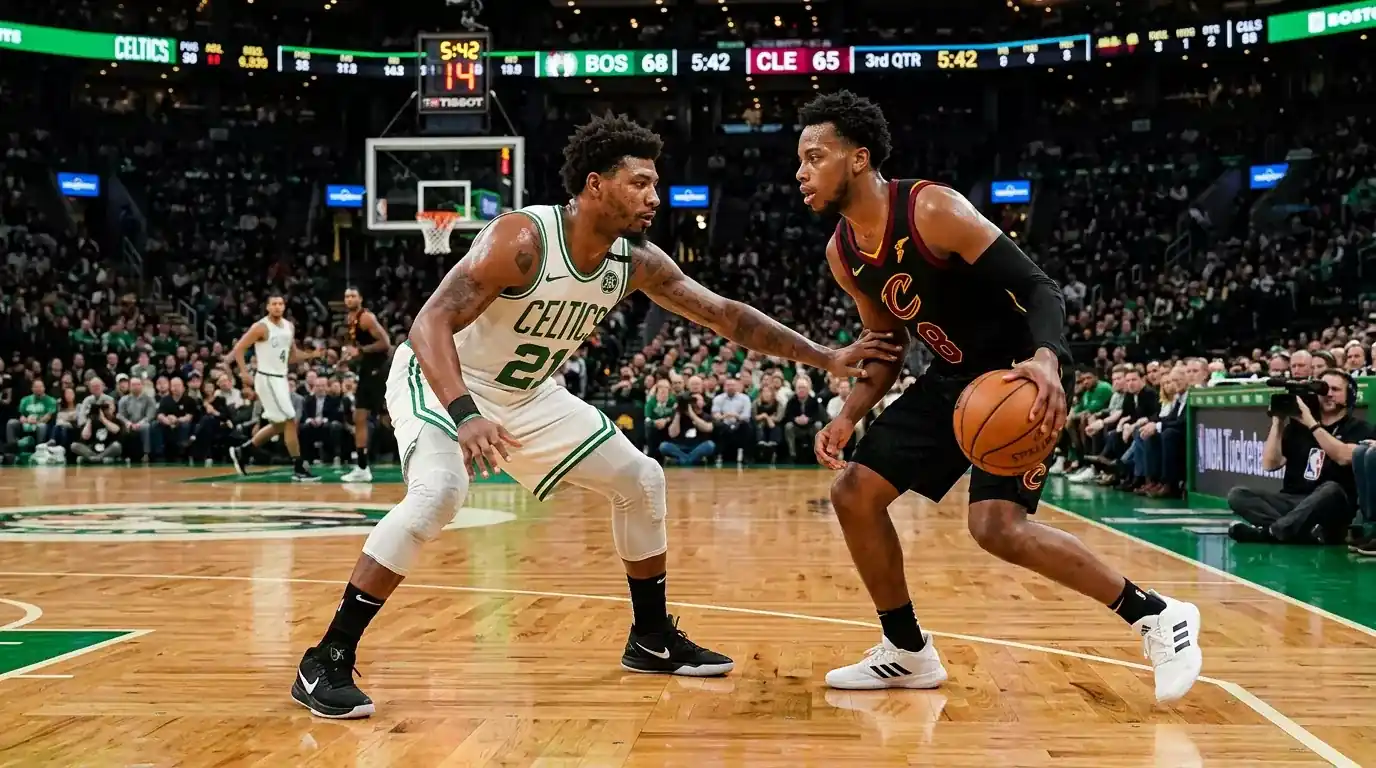
Several free platforms now publish individual defender matchup data — tracking which specific defender shadows a given offensive player across possessions and how opponents shoot against that defender. When an elite perimeter defender is assigned to shadow your target player, that creates a direct suppression of scoring probability that an aggregate defensive rating doesn’t capture. The inverse — when a weaker perimeter defender is the likely primary assignment — can create an exploitable over opportunity even against a team with a good overall DRTG.
The challenge with individual defender assignment data is that it’s probabilistic rather than definitive before the game. Which defender actually guards whom most depends on the defensive scheme, how the offensive team initiates possessions, and real-time tactical adjustments. The assignment data tells you the likely scenario; it doesn’t guarantee it. Using it as a directional input rather than a certainty — weighting the probability of being guarded by the elite defender rather than assuming it — is the appropriate analytical posture.
Defensive Rebounding Matchup: Finding Value in Big Man Prop Lines
Defensive matchup analysis for rebounds props operates on a different axis from scoring props. For rebounds, the key matchup variable is not which defender shadows the player, but rather how the two teams’ front-court units match up in terms of rebounding aggression and positioning. A dominant rebounder facing a passive front-court — one that doesn’t contest the glass aggressively — has a structural advantage that expands his expected rebounds above his season average.
Opponent defensive rebounding rate (DREB%) is the team-level metric: it measures what percentage of available defensive rebounds a team secures. Teams in the bottom quartile of DREB% are leaking offensive rebounds at a consistent rate — gifting second-chance opportunities to opposing big men. When your target player is a strong offensive rebounder facing a team with a poor DREB%, the over on his rebounds line is supported by a specific structural advantage rather than a general expectation of a good game.
The flip side for over/under decisions: a dominant rebounder facing an elite defensive rebounding team — one with multiple physical big men who box out aggressively — has his ceiling compressed. The expected rebounds shrink not because the player is worse, but because the opponent is specifically strong at the variable that drives his output. That directional clarity is what makes matchup research on rebounds props valuable: when the matchup is clearly favourable or clearly unfavourable, it provides conviction that pure average-based analysis can’t offer.
For integrating defensive matchup analysis with the usage and pace factors that together form a complete picture of a player’s expected output in any given game, systematic NBA prop betting strategy shows how these multiple analytical layers combine into a consistent pre-game research process.
Where can I find NBA individual defensive matchup data for free?
Several platforms publish individual defender matchup data at no cost. NBA.com’s tracking stats section includes on-ball defence data showing how specific defenders perform against opponents. Basketball Reference’s advanced stats and lineup tools provide related data. Third-party analytics sites like Cleaning the Glass also publish matchup-specific defensive metrics that are directly applicable to prop betting research.
How much does a tough defensive assignment typically depress a player’s scoring prop line?
The effect varies by defender quality and player offensive style, but matchups against elite perimeter defenders — particularly those who shadow opposing players across possessions — can suppress scoring efficiency by 3–8 percentage points in true shooting, which translates to a meaningful reduction in expected scoring output. For a player with a 20-point season average, that efficiency drop can shift the expected output by 1.5–3 points, which is often enough to flip an over to an under at a specific line.
Written by the editors at nba Props Bets.